
A network bottleneck refers to a discrete condition in which data flow is limited by computer or network resources.
The flow of data is controlled according to the bandwidth of various system resources.
If the system working on a network is delivering a higher volume of data than what is supported by the existing capacity of the network, then a network bottleneck will occur.
A common computing bottleneck culprit is network data interruption caused by microprocessor circuitry or TCP/IP.
Note that network overloading very rare case to impact the system performance.
NETSTAT
You can find any errors (RX-ERR,TX-ERR) using netstat command, see below command’s output which will describe you.
[root@Global-RH ~]# netstat -i
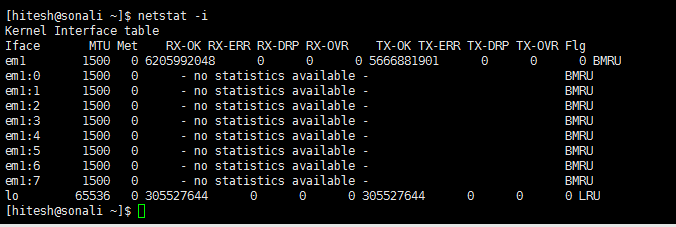
Kernel Interface table
DSTAT
DSTAT is very important tool to monitor the all the system resources.
If its not already installed, install it using:
[root@Global-RH ~]# yum install dtstat
You can see the network traffic details in “net/total” fields and here is the complete list of option for dstat tool.
[root@Global-RH ~]# dstat
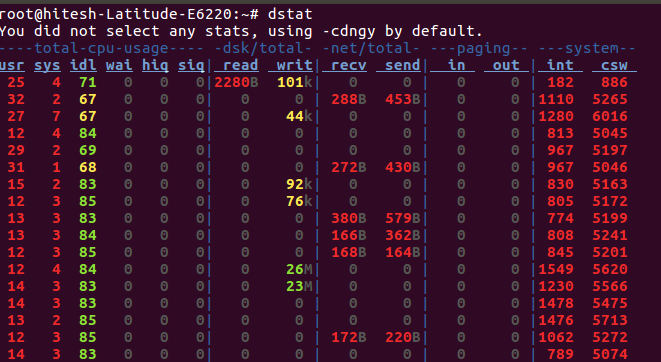
I recommend in case of NIC is causing a bottleneck dstat -nf and dstat -i or dstat -if. Things to look for:
Network data rates (in MB/s) equal or close to ~ 1/8th the bandwidth (in Mbits/s). E.g. 12MBytes/s for a 100Mbit card. Very high interrupt rates that correspond with high packet rate / network traffic.
SS
This command displays Linux TCP-UDP network and socket information
The ss command is used to show socket statistics.
It can display stats for packet sockets, TCP sockets, UDP sockets, DCCP sockets, RAW sockets, Unix domain sockets, and more.
It allows showing information similar to netstat command and can display more TCP and state information than other tools.
It is a new, incredibly useful and faster (as compare to netstat) tool for tracking TCP connections and sockets.
In particular it shows:
- all TCP sockets.
- all UDP sockets.
- all established ssh, ftp / http / https connections.
- all local processes connected to X server.
- filtering by state (such as connected, synchronized, SYN-RECV, SYN-SENT,TIME-WAIT), addresses and ports
- all the tcp sockets in state FIN-WAIT-1 and much more.
IFTOP
Now super fine command, which i love most!
You can install in cent os by type this command
[root@Global-RH ~]# yum install iftop
iftop is a command-line system monitor tool that produces a frequently updated list of network connections
By default, the connections are ordered by bandwidth usage, with only the “top” bandwidth consumers shown.